Detailed logger
- 100%
- 6.4 obsolete
- Enterprise
- Community
Planned
Overview
Sense/Net ECM has a robust Logging system built on Microsoft Enterprise Library. There are cases however when a few entries in the event log is not enough to track down an error related to heavy load or resource bottleneck. In that case you may turn on the DetailedLogger feature that provides more detailed information for operators and developers about events happening under the hood.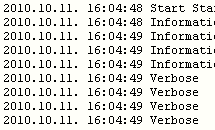
Please note that from version 6.5.3 Patch 4 the DetailedLogger module is no longer available: it has been replaced by the easy-to-use SnTrace API.
Details
Detailed logger gathers detailed log messages from different threads and writes a batch of lines regularly to the file system. It places a log file to the following directory under the web folder:
- App_Data\\DetailedLog
After a configured number of lines a new log file will be opened - see the configuration section below.
Logged events
In the core Sense/Net ECM product there are many places where we log events using the detaild logger. The following list is extended constantly as we add new log lines:
- Application start and end
- PotralContext module: OnEnter and OnEndRequest
- Content queries that were initiated and executed
- Lucene manager: index open/write and shutdown operations
- Content Repository shut down
- Service shut down events
Performance
In the Sesne/Net ECM core product the logger methods and their calls are conditionally compiled. This means the logger calls are not even present in release libraries used in production environment. Please see the details of switching this feature on later in this article.
Log lines are stored temporarily in a central buffer and written in batches to the file system for performance reasons. In case of a process kill or thread abourt this could lead to missing lines but leads to a significantly more stable and faster logging.
Logging modes
There are two different logging modes that result in different log lines in the log file.
Event logging
This is a simple log line containing a message:
3052	2014-08-13 04:01:25.86417	T:50	PCM.OnEndRequest GET http://localhost/features
>3053	2014-08-13 04:01:26.65225	T:62	PCM.OnEnter http://localhost/features/gallery/
Columns
- >: Signs the first line of a batch writing.
- Count: simple line counter. It is possible that some lines won't be in the right order due to the buffer.
- Timestamp: Time of calling the logger method.
- Thread id: identifier of the caller thread.
- Message: the message text filled with the given parameters.
Example
In source code you can write a log line like this:
DetailedLogger.Log("Shutting down {0}", svc.GetType().Name);
Please note that due to conditional compiling the line above will only be compiled into the library when needed. So it is advisable that you do not do information gathering outside of this method call. Put all the necessary formatting and collecting code inside the method call's parameter list so it does not slow down release libraries.
Operation logging
This mode is for monitoring the execution flow of important methods: you can place START and END logger calls wherever you want to track the execution.
>3003	2014-08-12 21:16:05.85041	T:64	Op:147 START	ContentQuery WorkflowStatus:Running .AUTOFILTERS:OFF | Top:0 Skip:0 Sort:
3004	2014-08-12 21:16:05.85141	T:64	Op:148 START	LucQuery.Execute WorkflowStatus:running | Top:2147483647 Skip:0 Sort:
3005	2014-08-12 21:16:05.85141	T:64	Op:148 END (00:00:00)	LucQuery.Execute WorkflowStatus:running | Top:2147483647 Skip:0 Sort:
3006	2014-08-12 21:16:05.85141	T:64	Op:147 END (00:00:00.0010001)	ContentQuery WorkflowStatus:Running .AUTOFILTERS:OFF | Top:0 Skip:0 Sort:
Columns
Additionally to the columns seen in the previous section, the operation mode has a few more:
- Operation Id: unique identifier of the operation for exploring nested events and other overlapping operations.
- Operation verb: "START" or "END".
- Operation duration: Time elapsed between the "START" and "END" calls.
Example
// create operation frame
var op = DetailedLogger.CreateOperation();
// start the operation frame and write a start message
DetailedLogger.Log(op, "Application_End");
// the relevant operation
SenseNet.ContentRepository.Repository.Shutdown();
// finish operation frame. Logger writes the "END" message and duration.
op.Finish();
Switch detailed logger ON
The logger methods and their calls are conditionally compiled in Sense/Net ECM. We have a custom conditional symbol for this feature:
- DIAGNOSTIC
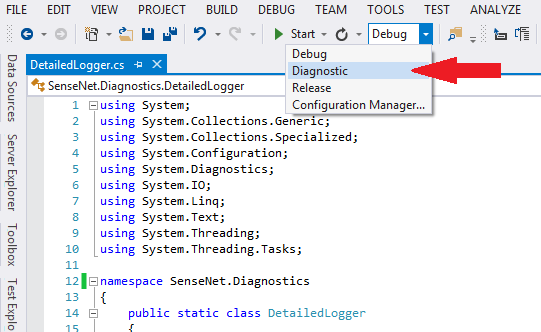
This means that the detailed logger can be switched on by using a different assembly set, that was compiled with the Diagnostic solution configuration.
Sense/Net ECM libraries
- Open the core product solution in Visual Studio 2013.
- Change the solution configuration to Diagnostic.
- Compile the solution, deploy & start the portal.
- Review the log file(s) in the app data folder mentioned above.
3rd party libraries
If you want to use the detailed logger in your custom libraries, you need to create a "Diagnostic" configuration for every project where you want to place DetailedLogger calls.
- Open your solution in Visual Studio 2013.
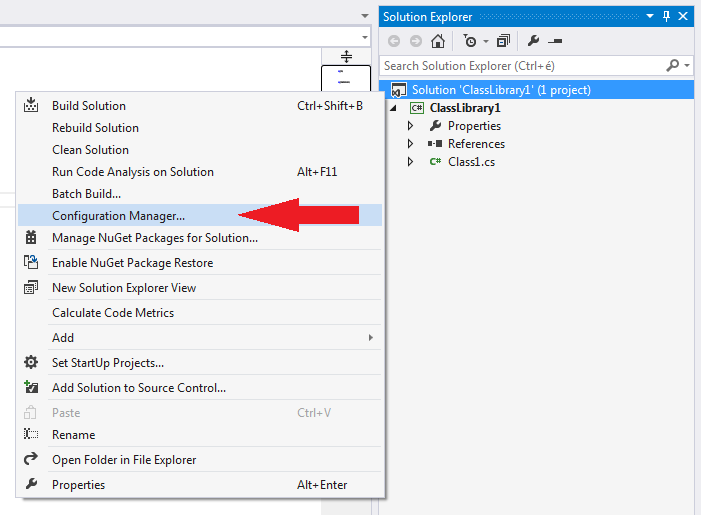
- In Solution Explorer right click on the solution and select "Configuration Manager...".
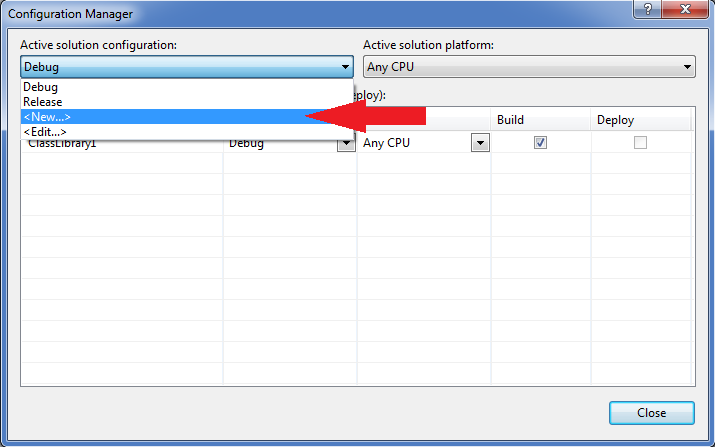
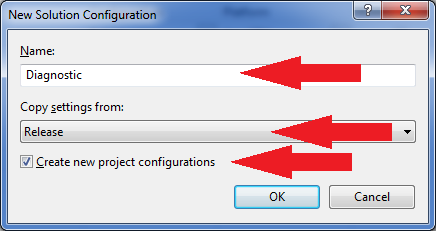
- Create new solution configuration.
- Name it "Diagnostic", select "Release" from the dropdown, check "Create new project configurations".
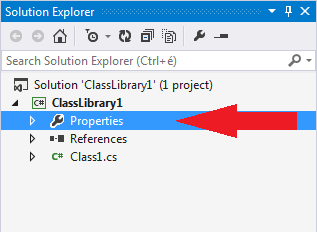
- Open the properties window of your project in Solution Explorer.
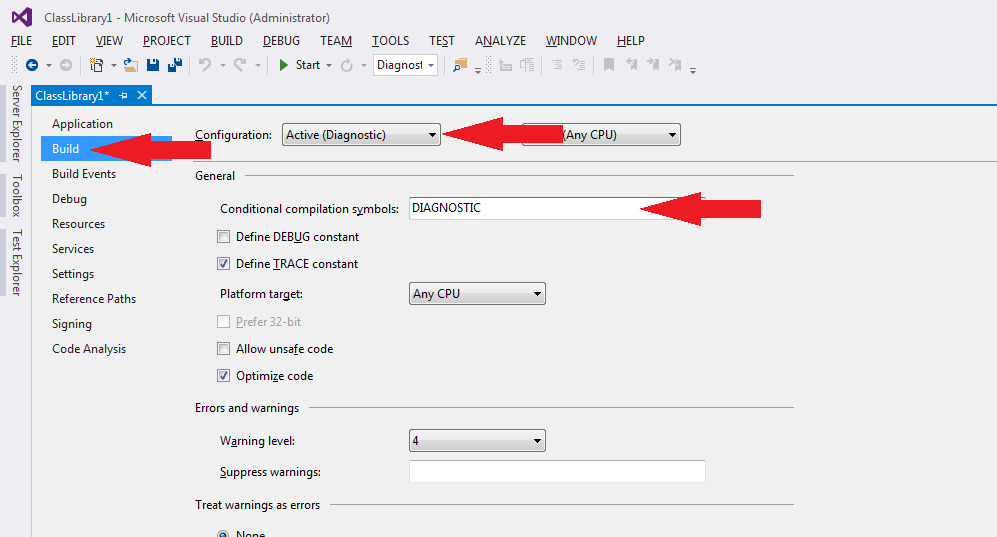
- Select the Build tab, ensure that Diagnostic is selected as Configuration and write "DIAGNOSTIC" into the Conditional compilation symbols textbox.
- Compile the solution, deploy & start the portal.
Buffering
The logger writes the lines to the file system through a line buffer. This solution increases the logging performance because the caller methods spend significally shorter time in the log method. A longer buffer means safer execution but larger memory footprint.
If the buffer is too small, the logger writes an error line:
>BUFFER OVERRUN ERROR: Buffer size is 100, unwritten lines : 185
243	2014-08-13 06:01:54.23410	T:14	WorkerB 5 (immediately)
The buffer size is not increased automatically, but you can configure it manually.
Logger tracing
After every 1000th line the logger writes a trace line that contains some logger-related information. Trace line frequency can be configured. By default the line contains only the buffer usage.
3052	2014-08-13 04:01:25.86417	T:50	PCM.OnEndRequest GET http://localhost/features
MaxPdiff: 31
In case you want to see more details, you need to define the DEBUG symbol on the SenseNet.Storage project (that is where DetailedLogger resides).
3052	2014-08-13 04:01:25.86417	T:50	PCM.OnEndRequest GET http://localhost/features
MaxPdiff: 112, MaxLog: 1197, PeakLog: 1183, MaxWrite: 11380, PeakWrite: 5771
The trace line contains the following columns:
- MaxPdiff: Buffer usage between two writes.
- MaxLog: Longest time in the log method in ticks.
- PeakLog: Peak time in the log method in ticks.
- MaxWrite: Longest time in the file writer method in ticks.
- PeakWrite: Peak time in the file writer method in ticks.
Configuration
You can fine-tune the behavior of the detailed logger by modifying the value of the following configuration items in the web.config.
- BufferSize: Allocated line buffer. Default: 10000.
- WriteToFileDelay: Time between end of previous and start of next writing in milliseconds. Default: 1000.
- MaxWritesInOneFile: Number of writes into a single file. Default: 100. After this a new log file will be created.
- LinesPerTrace: Frequency of writing information about the state of the detailed logger to the log. Default: 1000.
<sensenet>
	<detailedLogger>
      <add key="BufferSize" value="10000" />
      <add key="WriteToFileDelay" value="1000" />
      <add key="MaxWritesInOneFile" value="100" />
      <add key="LinesPerTrace" value="1000" />
    </detailedLogger>
</sensenet>
Related links
References
There are no external references for this article.
